
Pick the state and the city the policy supports.
Where a centre sits decides its talent pool, its pay bill and the incentives it can claim, and the three rarely point to the same city. CapSight sets states and cities side by side on installed workforce, industry mix and incentive policy, so the choice is made from the evidence and not from the largest hub by default.
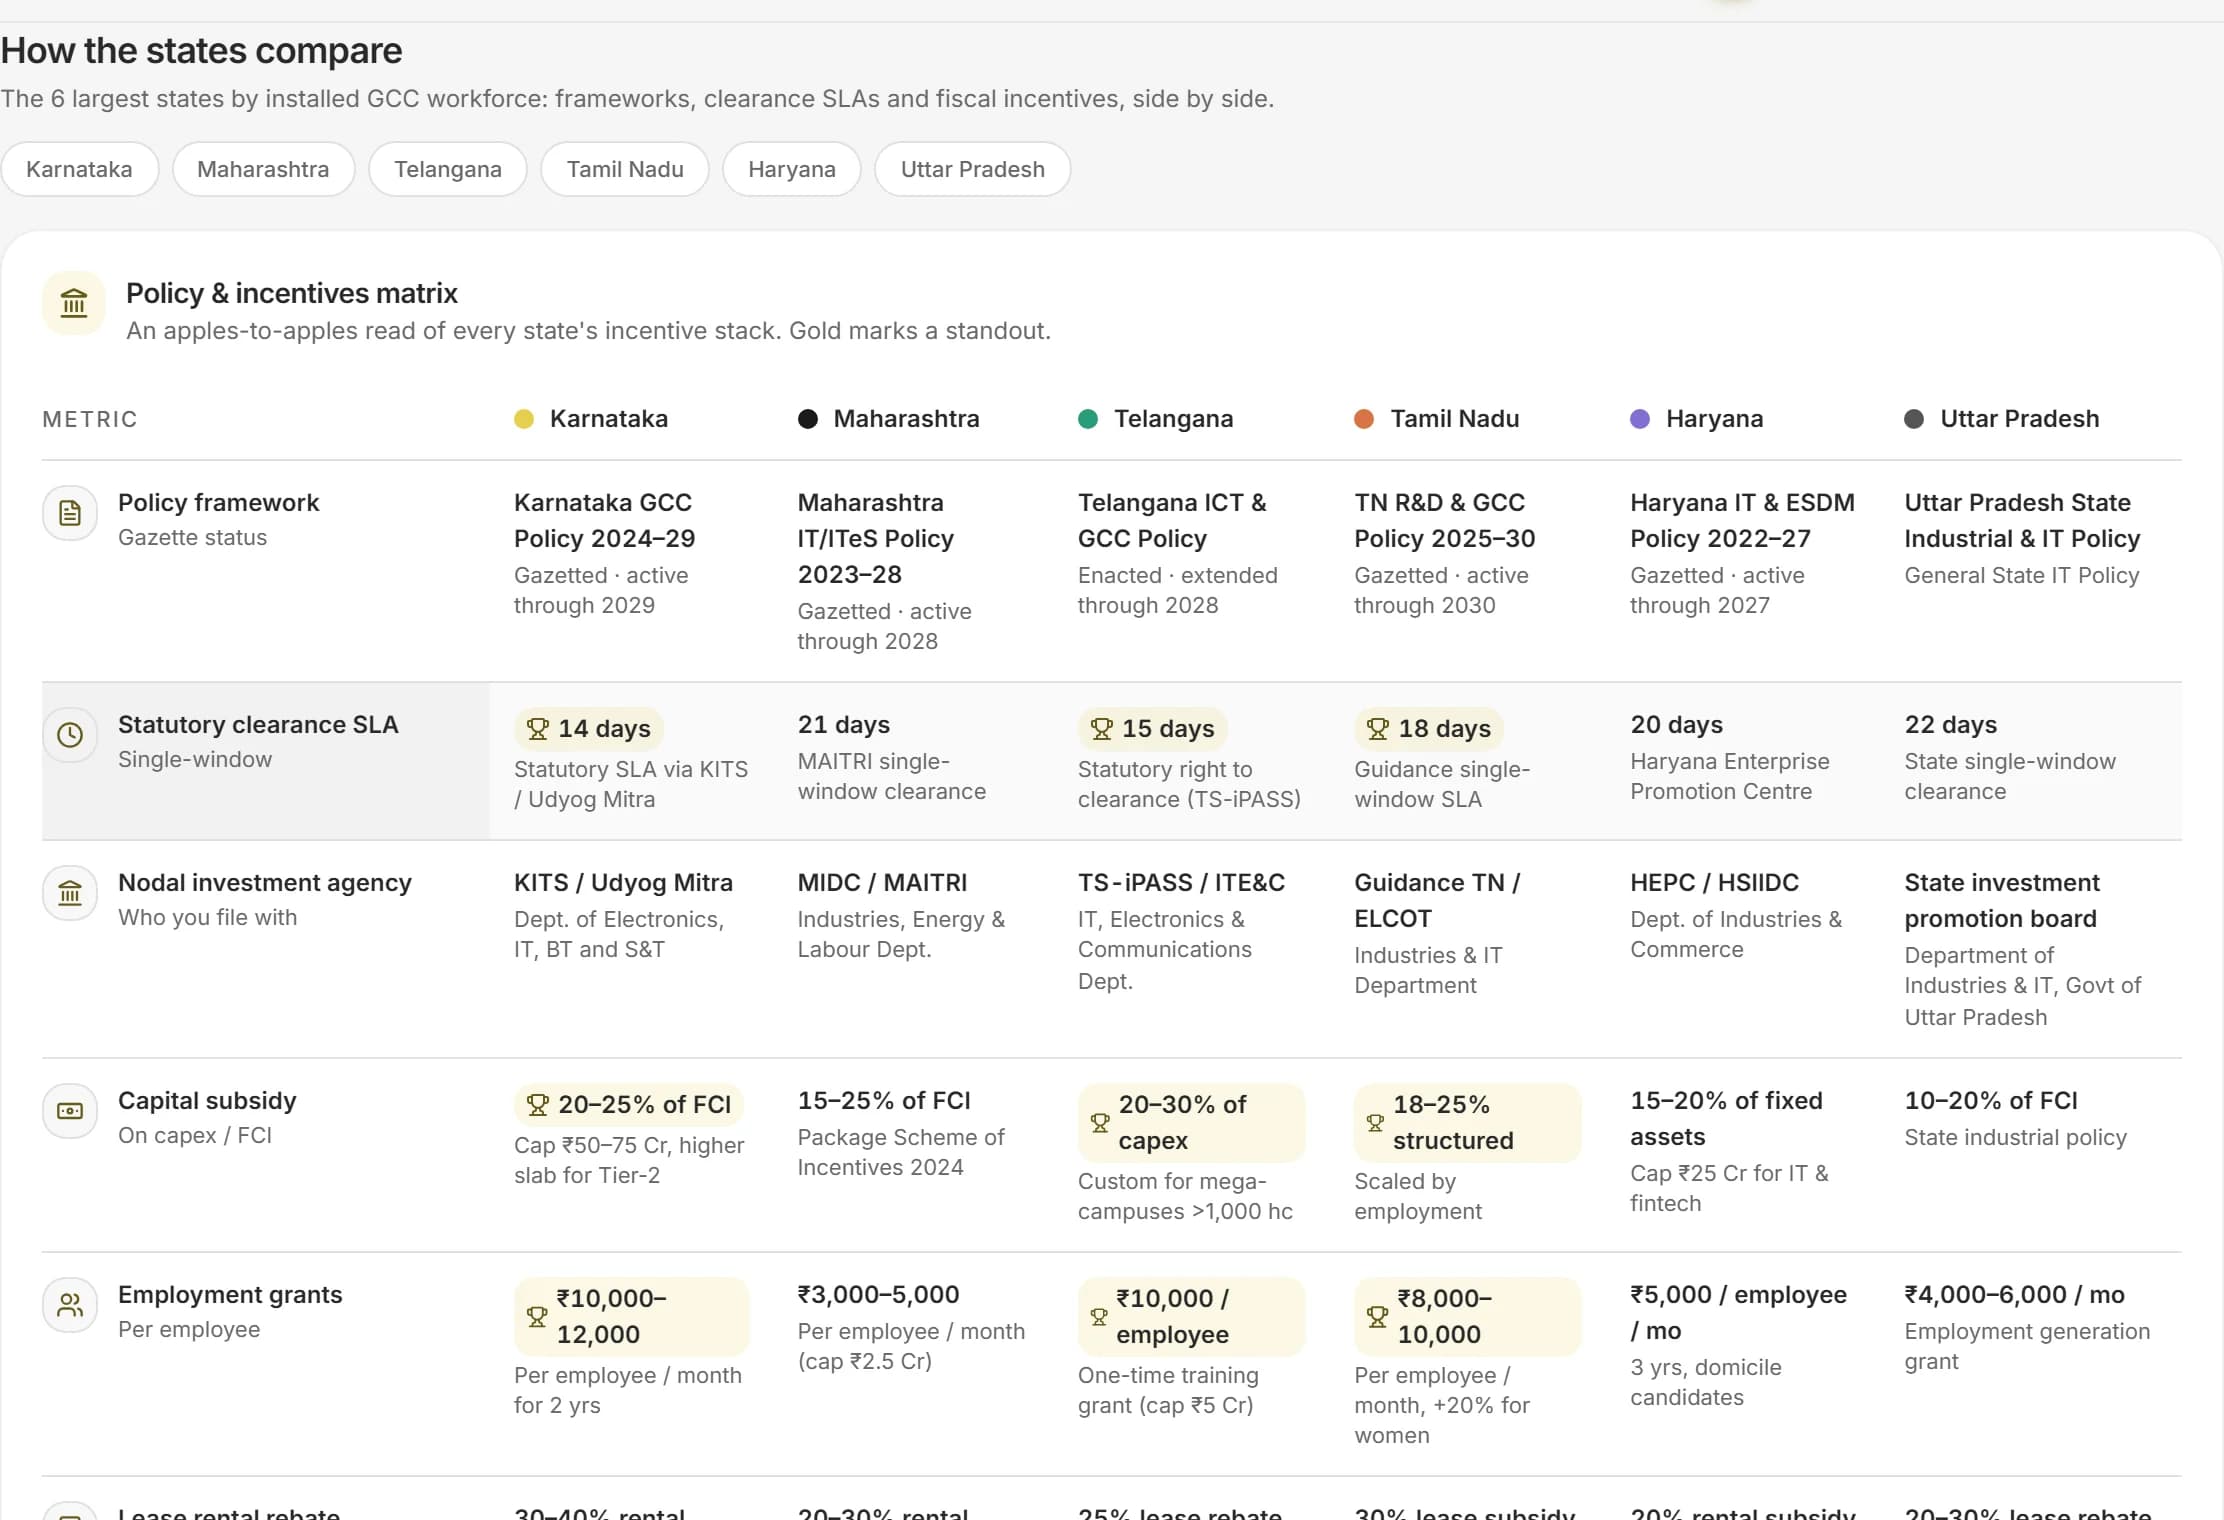 Sample data
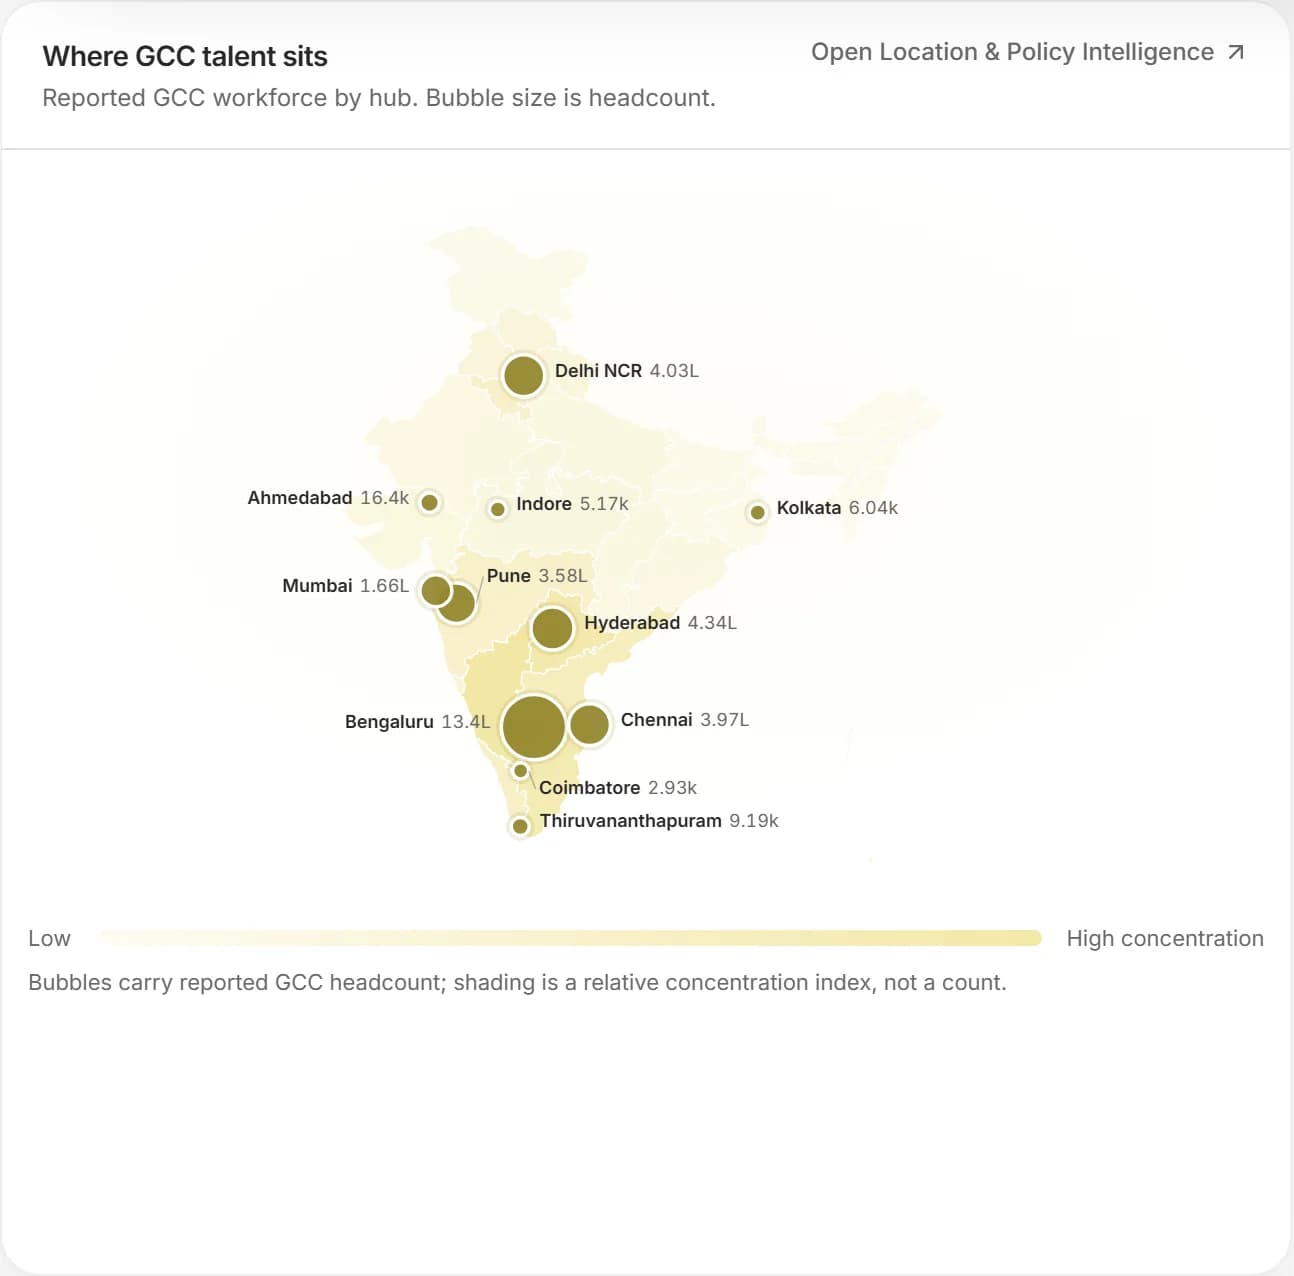
- States ranked by the GCC workforce they hold
- Incentive policy compared side by side
- The industries each city already hosts
The GCC list this page draws on.
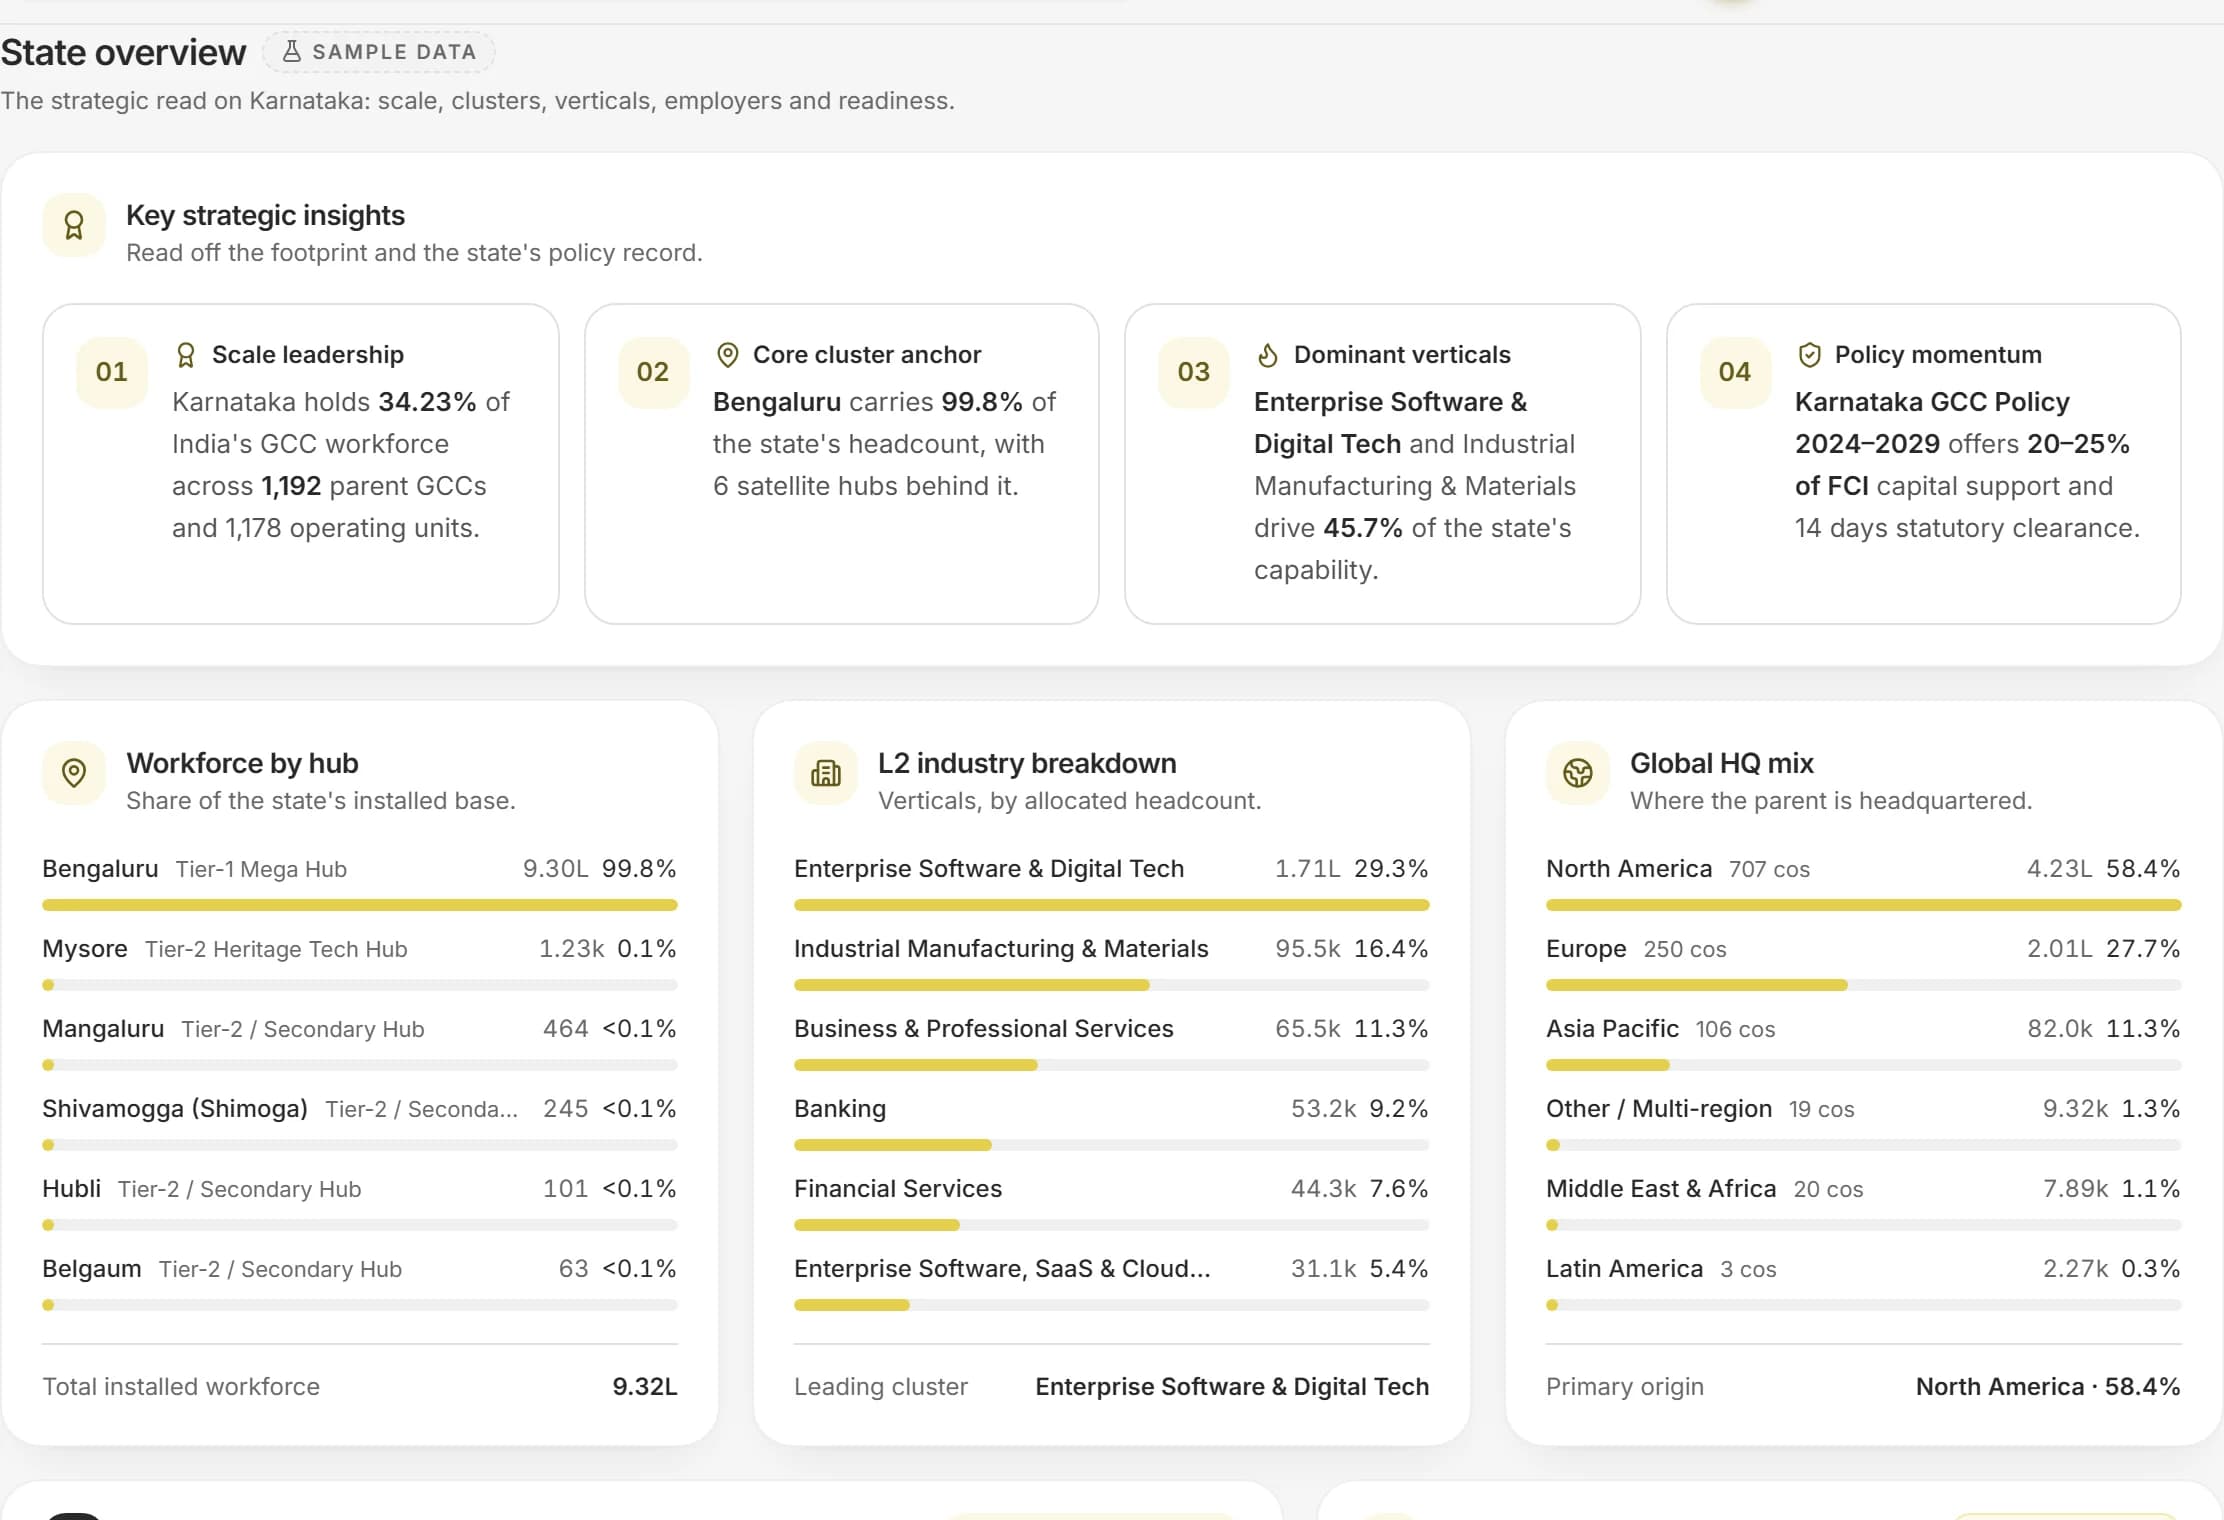 Sample data
One state's workforce, industry mix and policy momentum.
A screen from the product itself. The counts beside it are read from the platform directory.
- 18
- states and union territories
- 35
- Indian cities with a centre
- 4,439
- GCC centres
- 2.85M
- people in GCCs across India
Choose a Location, in four parts.
Each part is something the product does today, with the data it uses named on the page.
States and cities, ranked
Every state and union territory with its installed GCC workforce, the share of the national total and the cities inside it, so you start from where capability already is.
Policy you can compare
Incentive frameworks, clearance times and subsidy terms set in one table, state by state, so a headline incentive is read against how long the approval takes.
A read of each state
Workforce by city, the industries concentrated there and where parent companies are headquartered, summarised into a short strategic read for the state you are weighing.
A path from shortlist to brief
Carry the two or three states that hold up into a location report, with the evidence on its pages and the sources named.

One market, twelve decisions.
The same list of GCCs, the same cities and the same pay benchmarks sit under every solution, so where to build, what to build, what to pay and whom to hire are answered from one set of facts that agree with each other.
Request access- 0.0%
- Of the workforce is in Bengaluru
- 0
- Mega GCCs, over 10,000 people each
- 0
- GCCs set up since 2021
- 0
- Companies with pay benchmarks
What a state is compared on
The same dimensions for every state, so a gap in one is visible next to a strength in another. A dimension with no published figure is left empty and never estimated.
- DimensionInstalled workforceWhat you readPeople in GCCs, by state and by cityWhy it mattersDepth of the pool you will hire from
- DimensionCentresWhat you readNumber of centres and the companies behind themWhy it mattersHow many peers you will compete with
- DimensionIndustry mixWhat you readWhich industries cluster in the stateWhy it mattersWhether your sector already has a presence
- DimensionIncentive policyWhat you readFramework, subsidies and termsWhy it mattersWhat the state offers a new centre
- DimensionClearanceWhat you readStatutory clearance timelinesWhy it mattersHow fast you can open
- DimensionParent HQsWhat you readWhere the centres' parent companies sitWhy it mattersThe home markets the state draws from
Ask the question the way you would ask a colleague.
These are the kinds of questions this page is built for. Each one is answered from the data on it, not from a general model of the market.
Which states hold the most GCC workforce, and which cities inside them?
How do the incentive terms of Karnataka, Telangana and Tamil Nadu compare?
Which industries already cluster in the cities I am considering?
How many centres, and which companies, already operate in my shortlist?
Is the workforce concentrated in one hub in a state, or spread across several?
Where is the next tier of cities, and who has already moved there?
From first look to a decision you can show.
Start from the ranking
Read the states by installed workforce and note where your sector already clusters.
Read the policy
Set the incentive terms and clearance times of the states you are weighing in one table.
Look inside the state
Open a state to see its cities, its industry mix and who already operates there.
Report the shortlist
Turn the two or three states that hold up into a designed location report.
Built for the people who own the decision.
Site-selection and real-estate leads
A shortlist of states and cities with the policy and workforce evidence beside each.
GCC heads weighing a second site
Where peers already sit, and what a new location would add.
Government relations and finance
Incentive terms and approval timelines in one comparable table.
What is in it, and what is not yet.
We say plainly what the data holds today and what we are still adding, so nothing here is implied.
- 35 Indian cities with a centre, rolled up to states and union territories
- Installed workforce and centre counts by state and city
- Industry mix and parent-company HQ regions for each state
- State incentive policy and statutory clearance timelines
- Office-market rents by city
- Policy change alerts
The terms on this page, defined.
Every figure on a CapSight page comes with its definition, so you never have to guess what a number is counting.
- GCC
- A Global Capability Centre: a centre a company runs in India for its own global work, such as engineering, analytics, finance, operations or support. It is part of the company, not an outside vendor.
- Platform Industry
- The one industry grouping CapSight uses for every company, so a filter or a chart means the same thing on every page. There are 10.
- Tier 1 and Tier 2 cities
- Tier 1 is the eight established hubs: Bengaluru, Chennai, Hyderabad, Mumbai, Pune, Delhi NCR, Kolkata and Ahmedabad. Every other city is Tier 2.
- CTC
- Cost to company: the annual total an employer commits to one person, shown in lakh rupees. One lakh is 100,000.
- Percentile band (P25, P50, P75, P90)
- P50 is the median: half the people in the sample earn less. P25 and P75 mark the edges of the middle half, and P90 marks the top tenth. A pay figure is always read with its band.
- Build journey
- A documented account of how a comparable centre started: its first city, its first team and how it grew, with each figure cited to its source.
Before you ask.
Does it tell me which city to pick?
It lays the states and cities out on the same measures, so you can see the trade-offs. The choice stays yours and the numbers are on the page.
How is a state's workforce counted?
From the centres the platform holds, summed to the state. Where a centre's size is a band, the band is shown and not a false point figure.
Does it cover cities outside the large hubs?
Yes. Tier 2 cities appear wherever a centre is recorded, so a city on the way up is visible before it is crowded.
Bring the GCC decision you are working on.
Where to put the next 300 engineers, what a peer pays its architects, who owns the charter you are selling into. Ask it in CapSight, and see the market, the peers and the people behind the answer.
Already on CapSight? Sign in
- 01Request access
We set up your organisation and its admin, who adds the team.
- 02Ask the question you have
Market, peer, pay or people, answered from one dataset.
- 03Walk it through with us
A 30-minute session with the research desk, on your decision.

Capability maturity of five BFSI GCCs in Bengaluru, by function.
Illustrative example