
Plan the team against the market it hires from.
Headcount plans meet the same obstacles every year: roles that cost more than budgeted, cities where everyone is hiring and skills that have become scarce. CapSight shows hiring activity, centre headcount, annual pay and skill premiums together, so a plan is checked against the market before it is approved.
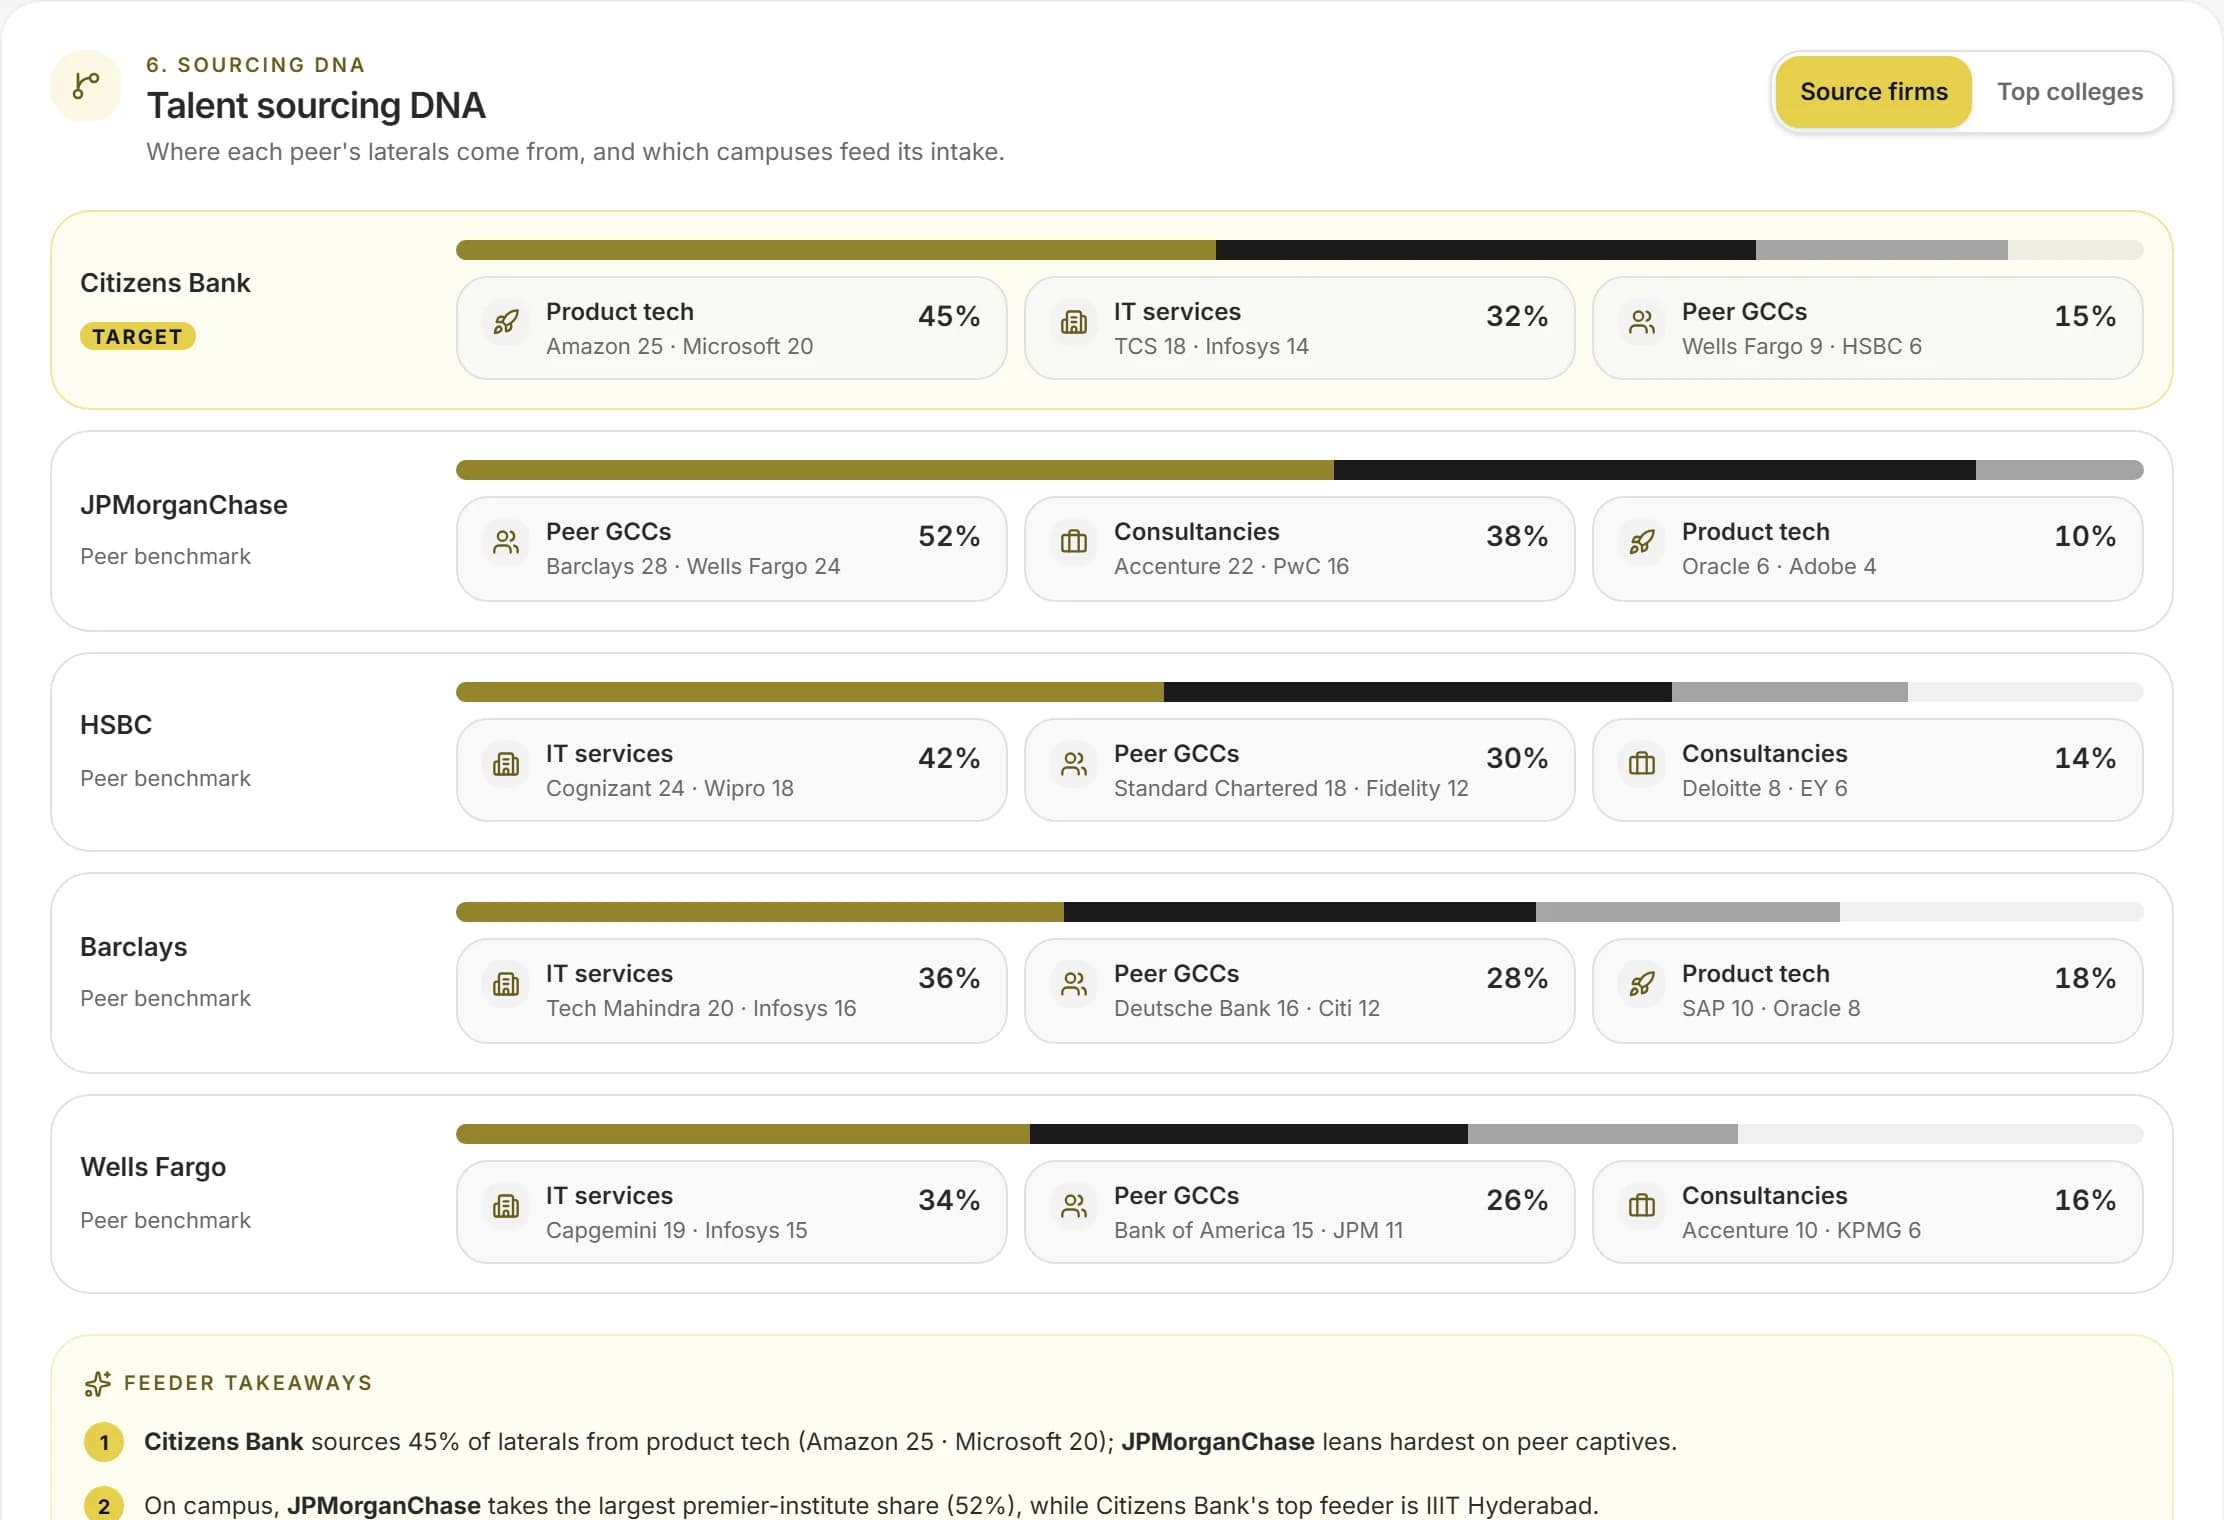 Sample data
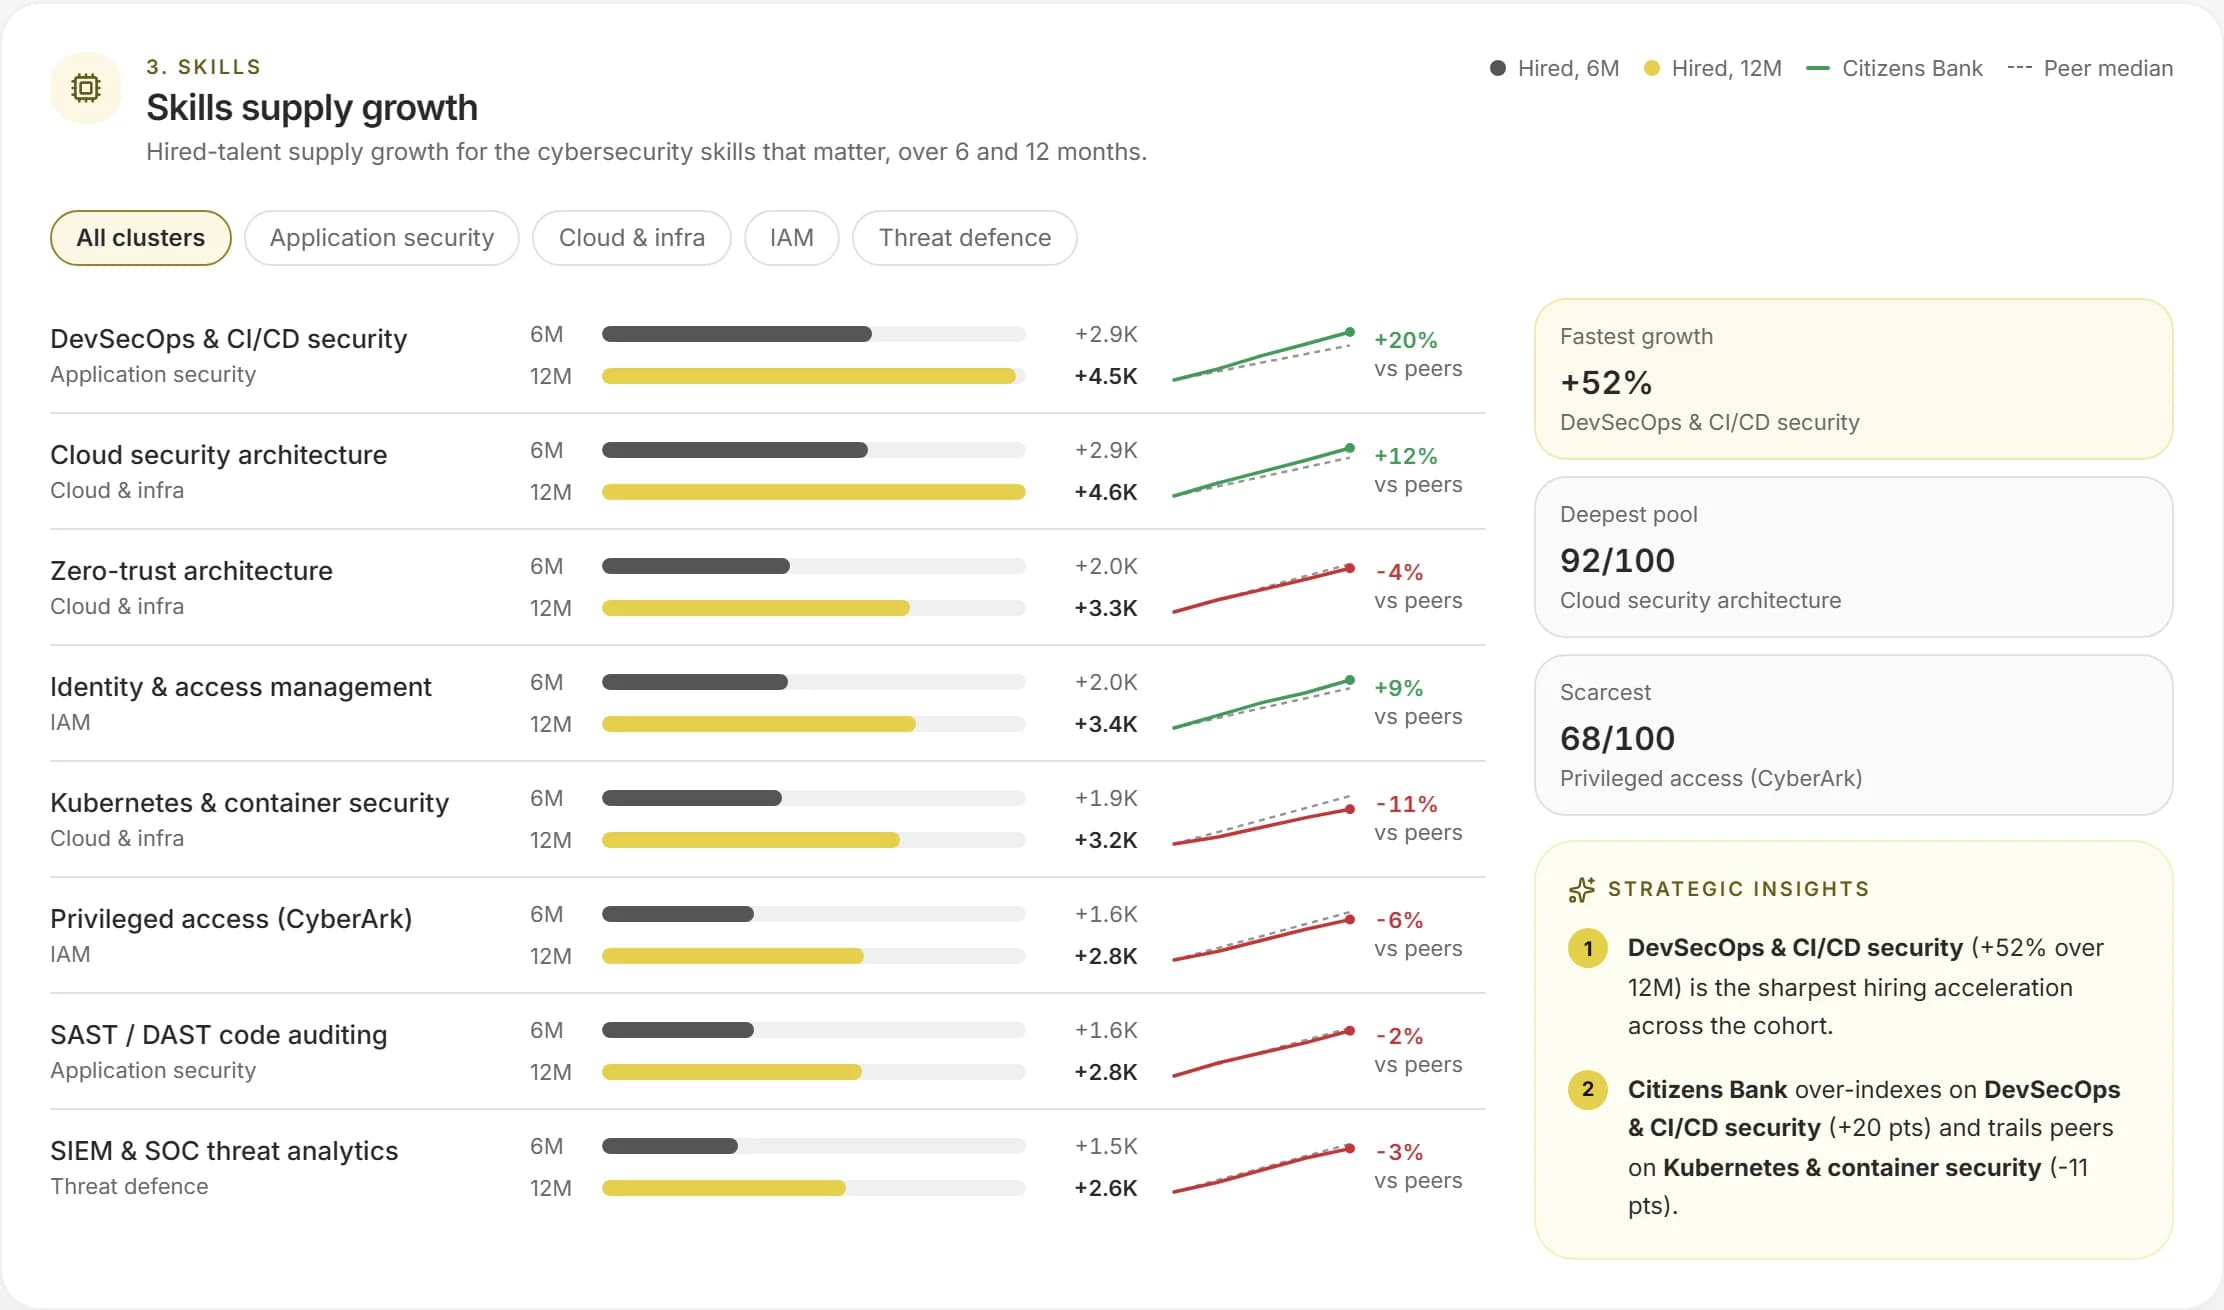
- Hiring activity by function, role, seniority and city
- The pay for the role at the band you plan to hire
- Which skills carry a premium, and how large
The GCC list this page draws on.
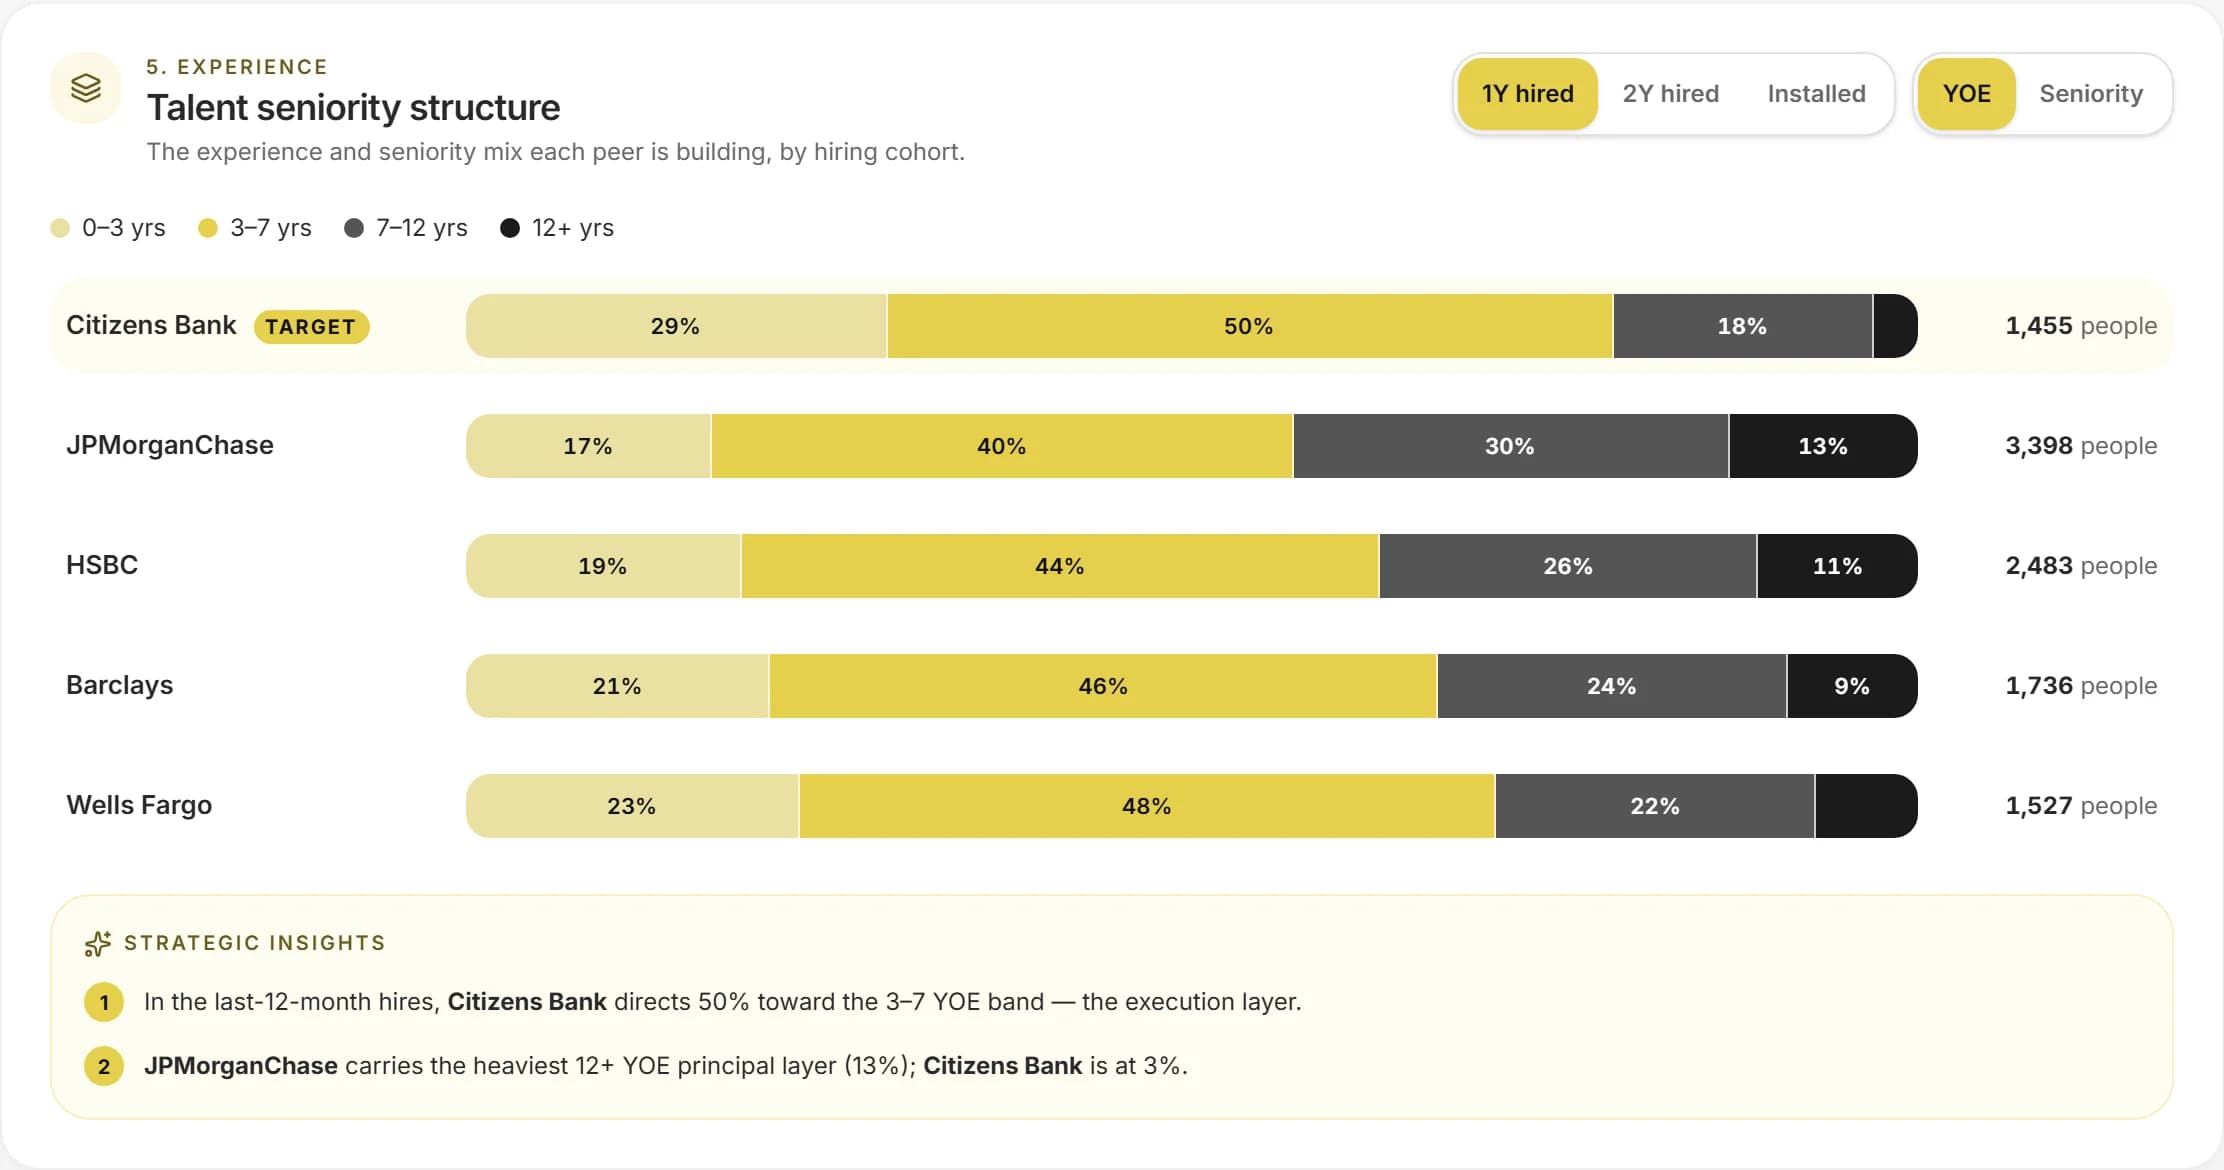 Sample data
The experience mix of every peer's team.
A screen from the product itself. The counts beside it are read from the platform directory.
- 2.85M
- people in GCCs across India
- 43
- mega GCCs, over 10,000 people
- 2,500
- company profiles
- 35
- Indian cities with a centre
Plan Workforce, in four parts.
Each part is something the product does today, with the data it uses named on the page.
Demand you can read by role
Job postings attributed to GCCs, broken down by function, job family, role group, seniority, city and industry, with month-on-month change over 30, 60 or 90 days.
Where the capacity already sits
Reported centre headcount by hub and company, so you can see which cities already hold the teams you will recruit alongside.
A budget that matches the band
Annual CTC percentiles for the role at the experience level you will hire, so the plan names the band rather than an average of all of them.
Skill premiums with their limits
The pay uplift the market puts on scarce skills, with the period, the quality of the evidence and a marker where the figure sits at the published ceiling.

One market, twelve decisions.
The same list of GCCs, the same cities and the same pay benchmarks sit under every solution, so where to build, what to build, what to pay and whom to hire are answered from one set of facts that agree with each other.
Request access- 0
- States and union territories with a centre
- 0
- Companies with pay benchmarks
- 0.0%
- Of the workforce is in Bengaluru
- 0
- GCCs set up since 2021
From a planning question to its evidence
Each planning question maps to a view with a stated source and period.
- Planning questionIs hiring for this role heating up?EvidenceJob postings, month-on-monthWhat you readChange over 30, 60 and 90 days, by city and seniority
- Planning questionWhat will the role cost?EvidenceAnnual CTC benchmarksWhat you readP25, P50, P75 and P90 for the band, by city and industry
- Planning questionWhich skills are scarce?EvidenceSkill premium fileWhat you readPremium over a comparable role, with period and quality
- Planning questionWhere do peers already hire?EvidenceCentre headcount by hubWhat you readReported workforce by city and company
- Planning questionHow do we compare with peers?EvidenceCompany pay positioningWhat you readMedian against the industry and market at the same band
Ask the question the way you would ask a colleague.
These are the kinds of questions this page is built for. Each one is answered from the data on it, not from a general model of the market.
Which functions and roles are being hired for most in Hyderabad right now?
Is demand for senior engineers rising faster than for early-career hires?
What does a four-to-eight-year-experience data engineer cost in Pune compared with Bengaluru?
Which AI skills carry a premium in the market, and is the figure capped?
Where is the hiring mix tilting from engineering to operations?
How does our median pay sit against the industry's at the same experience band?
From first look to a decision you can show.
Choose the roles
Pick the function, family or role group and the seniority you plan to hire.
Read demand
See hiring activity by city with change over the last 30, 60 or 90 days.
Price it
Read the pay band for each city at your experience level and add the skill premium where it applies.
Write it down
Capture the plan as a talent and pay report for finance and leadership.
Built for the people who own the decision.
Talent acquisition and people leaders
A defensible hiring plan with the competition and the cost stated.
Workforce and finance planners
Budgets that name the experience band they price.
Total-rewards teams
Market percentiles and skill premiums for offer decisions.
What is in it, and what is not yet.
We say plainly what the data holds today and what we are still adding, so nothing here is implied.
- Hiring activity from job postings with month-on-month change
- Reported centre headcount by hub and company
- Annual CTC percentiles by city, role, band and industry
- AI skill premiums for the market and for companies, dated September 2026
- Talent-supply pools by function and seniority
- Attrition and diversity
The terms on this page, defined.
Every figure on a CapSight page comes with its definition, so you never have to guess what a number is counting.
- GCC
- A Global Capability Centre: a centre a company runs in India for its own global work, such as engineering, analytics, finance, operations or support. It is part of the company, not an outside vendor.
- Platform Industry
- The one industry grouping CapSight uses for every company, so a filter or a chart means the same thing on every page. There are 10.
- Tier 1 and Tier 2 cities
- Tier 1 is the eight established hubs: Bengaluru, Chennai, Hyderabad, Mumbai, Pune, Delhi NCR, Kolkata and Ahmedabad. Every other city is Tier 2.
- CTC
- Cost to company: the annual total an employer commits to one person, shown in lakh rupees. One lakh is 100,000.
- Percentile band (P25, P50, P75, P90)
- P50 is the median: half the people in the sample earn less. P25 and P75 mark the edges of the middle half, and P90 marks the top tenth. A pay figure is always read with its band.
- Build journey
- A documented account of how a comparable centre started: its first city, its first team and how it grew, with each figure cited to its source.
Before you ask.
What does hiring activity measure?
Employer activity in job postings attributed to GCCs. It shows demand; it does not establish how easy a role is to fill.
Why does every pay figure name an experience band?
A median across all experience levels hides the part you are budgeting for, so each figure states its band, with 4 to 8 years as the default.
Are skill premiums estimates?
They are published figures with their quality shown. Where a premium sits at the ceiling of the published range, it is marked as capped.
Bring the GCC decision you are working on.
Where to put the next 300 engineers, what a peer pays its architects, who owns the charter you are selling into. Ask it in CapSight, and see the market, the peers and the people behind the answer.
Already on CapSight? Sign in
- 01Request access
We set up your organisation and its admin, who adds the team.
- 02Ask the question you have
Market, peer, pay or people, answered from one dataset.
- 03Walk it through with us
A 30-minute session with the research desk, on your decision.

Capability maturity of five BFSI GCCs in Bengaluru, by function.
Illustrative example