
Read the workforce and the skills behind the headcount.
Headcount tells you how big a centre is. Hiring activity tells you what it is building next, and skill premiums tell you what the market is paying for. CapSight puts the three side by side by function, city and seniority.
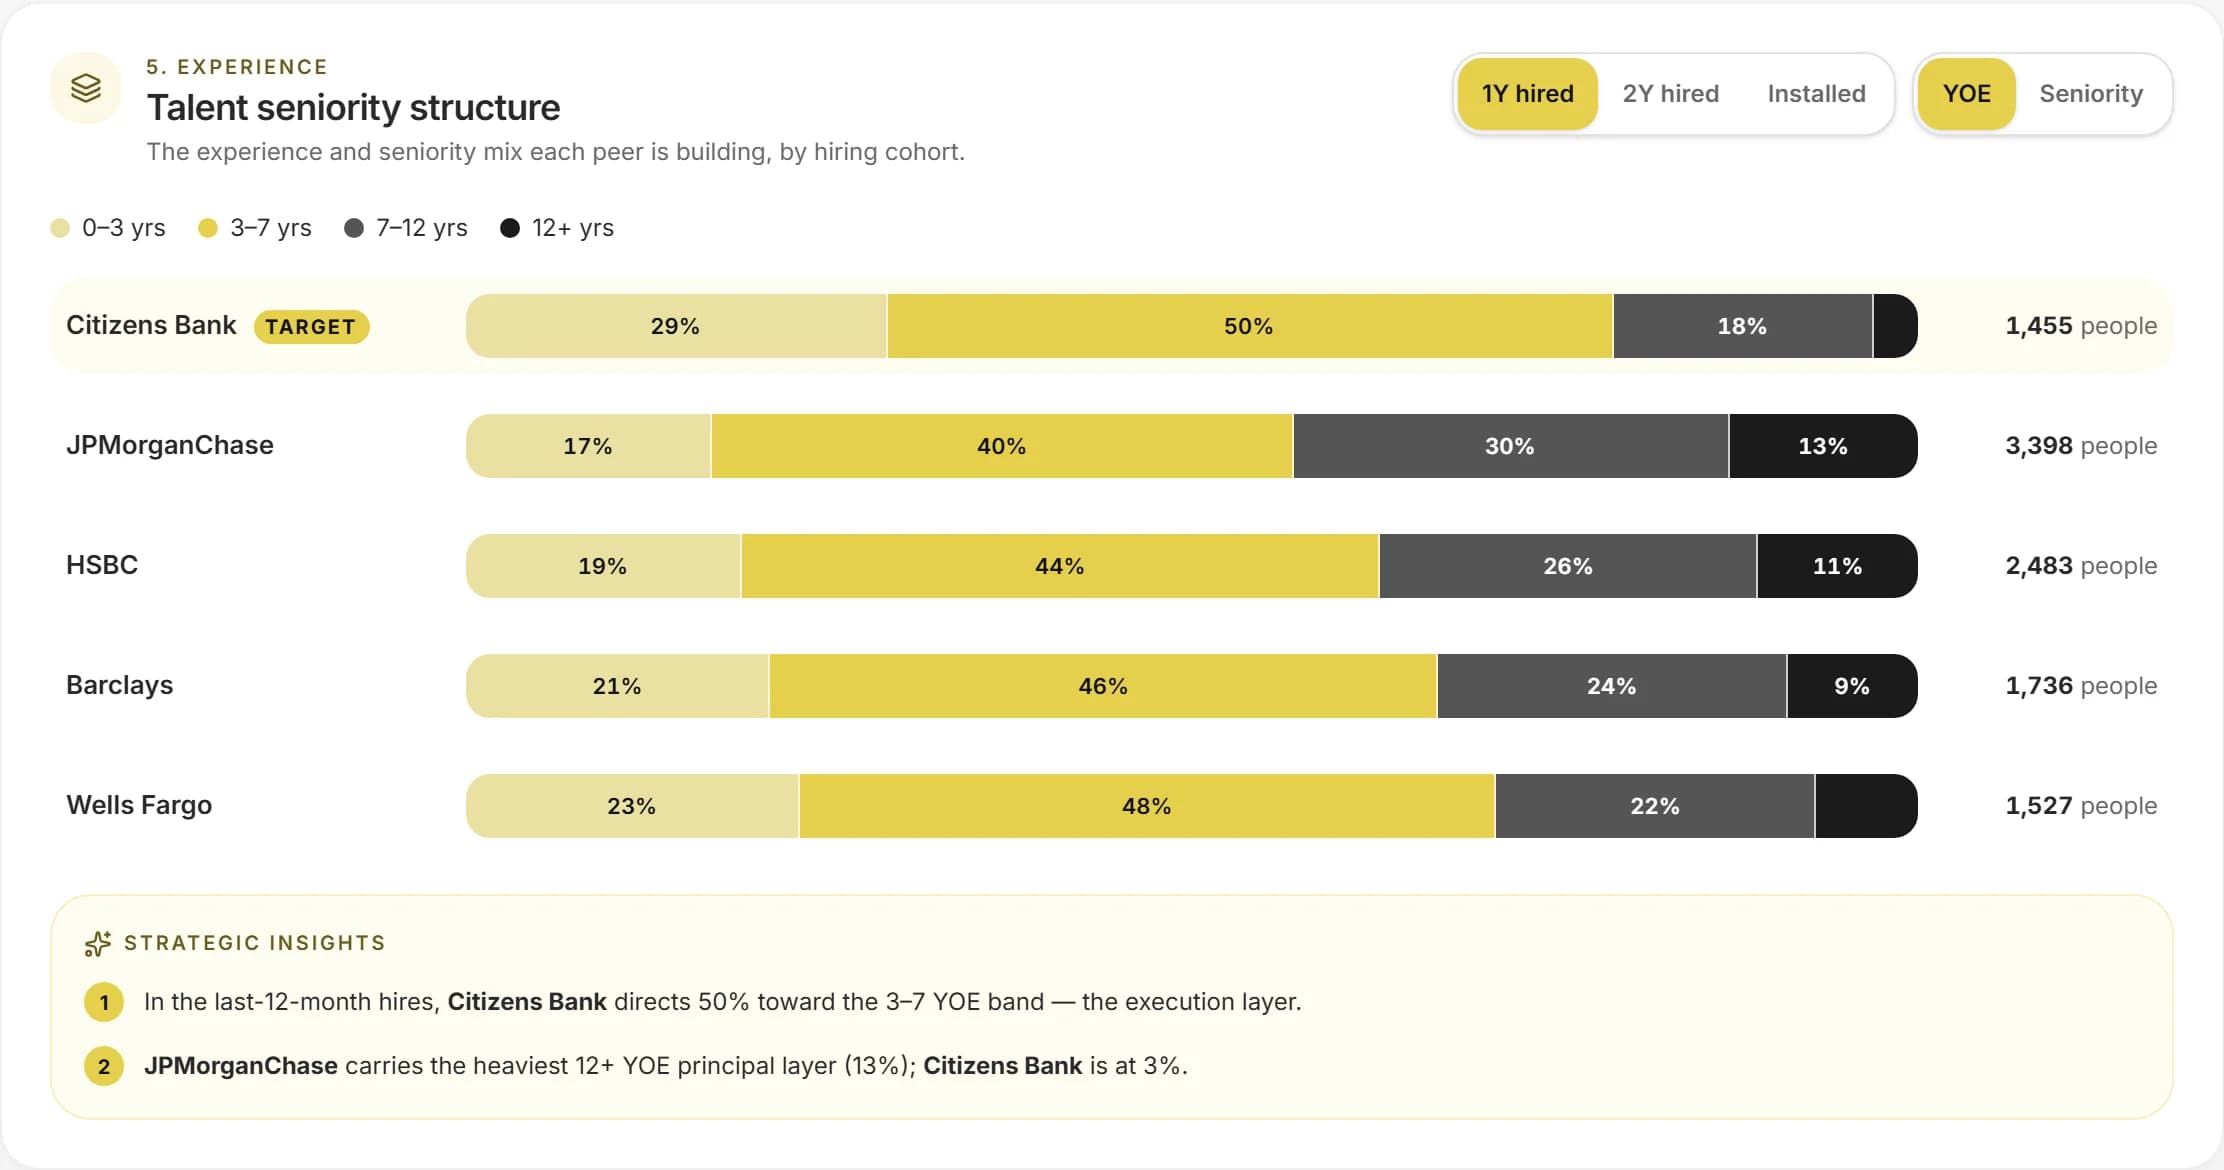 Sample data
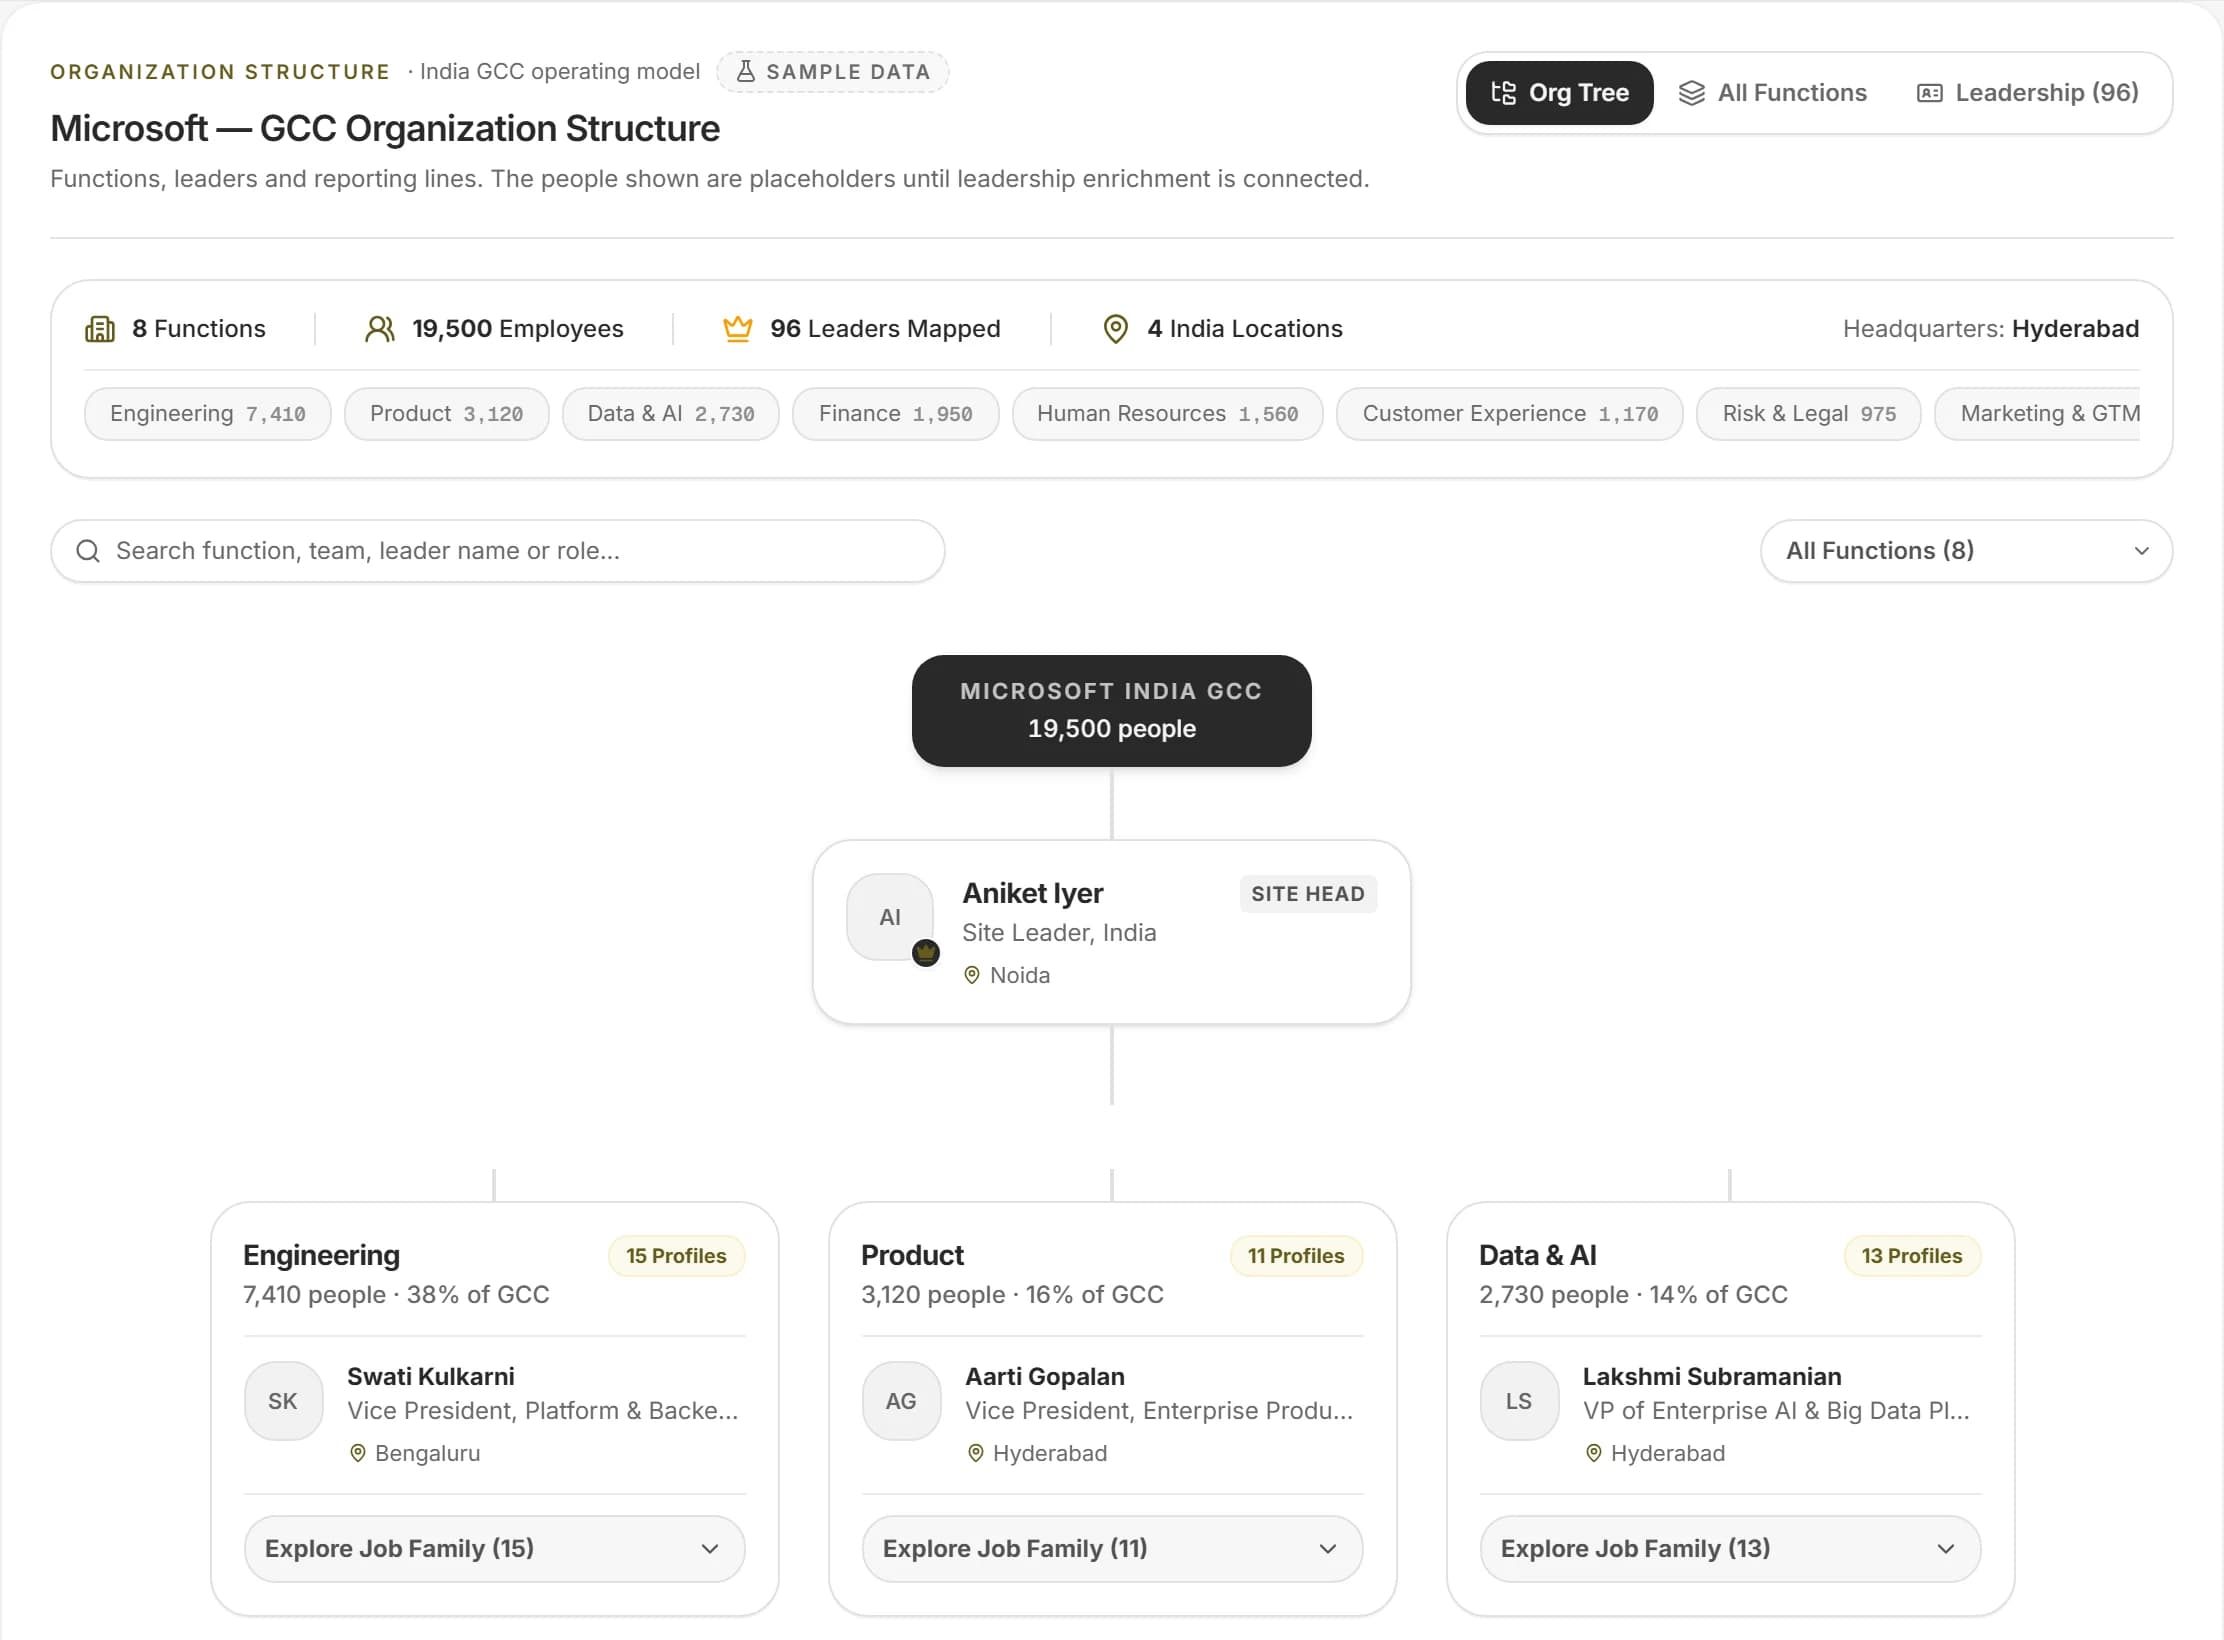
- Reported workforce by hub and company
- Hiring activity by function, family and role
- Skill premiums with their period and quality
The GCC list this page draws on.
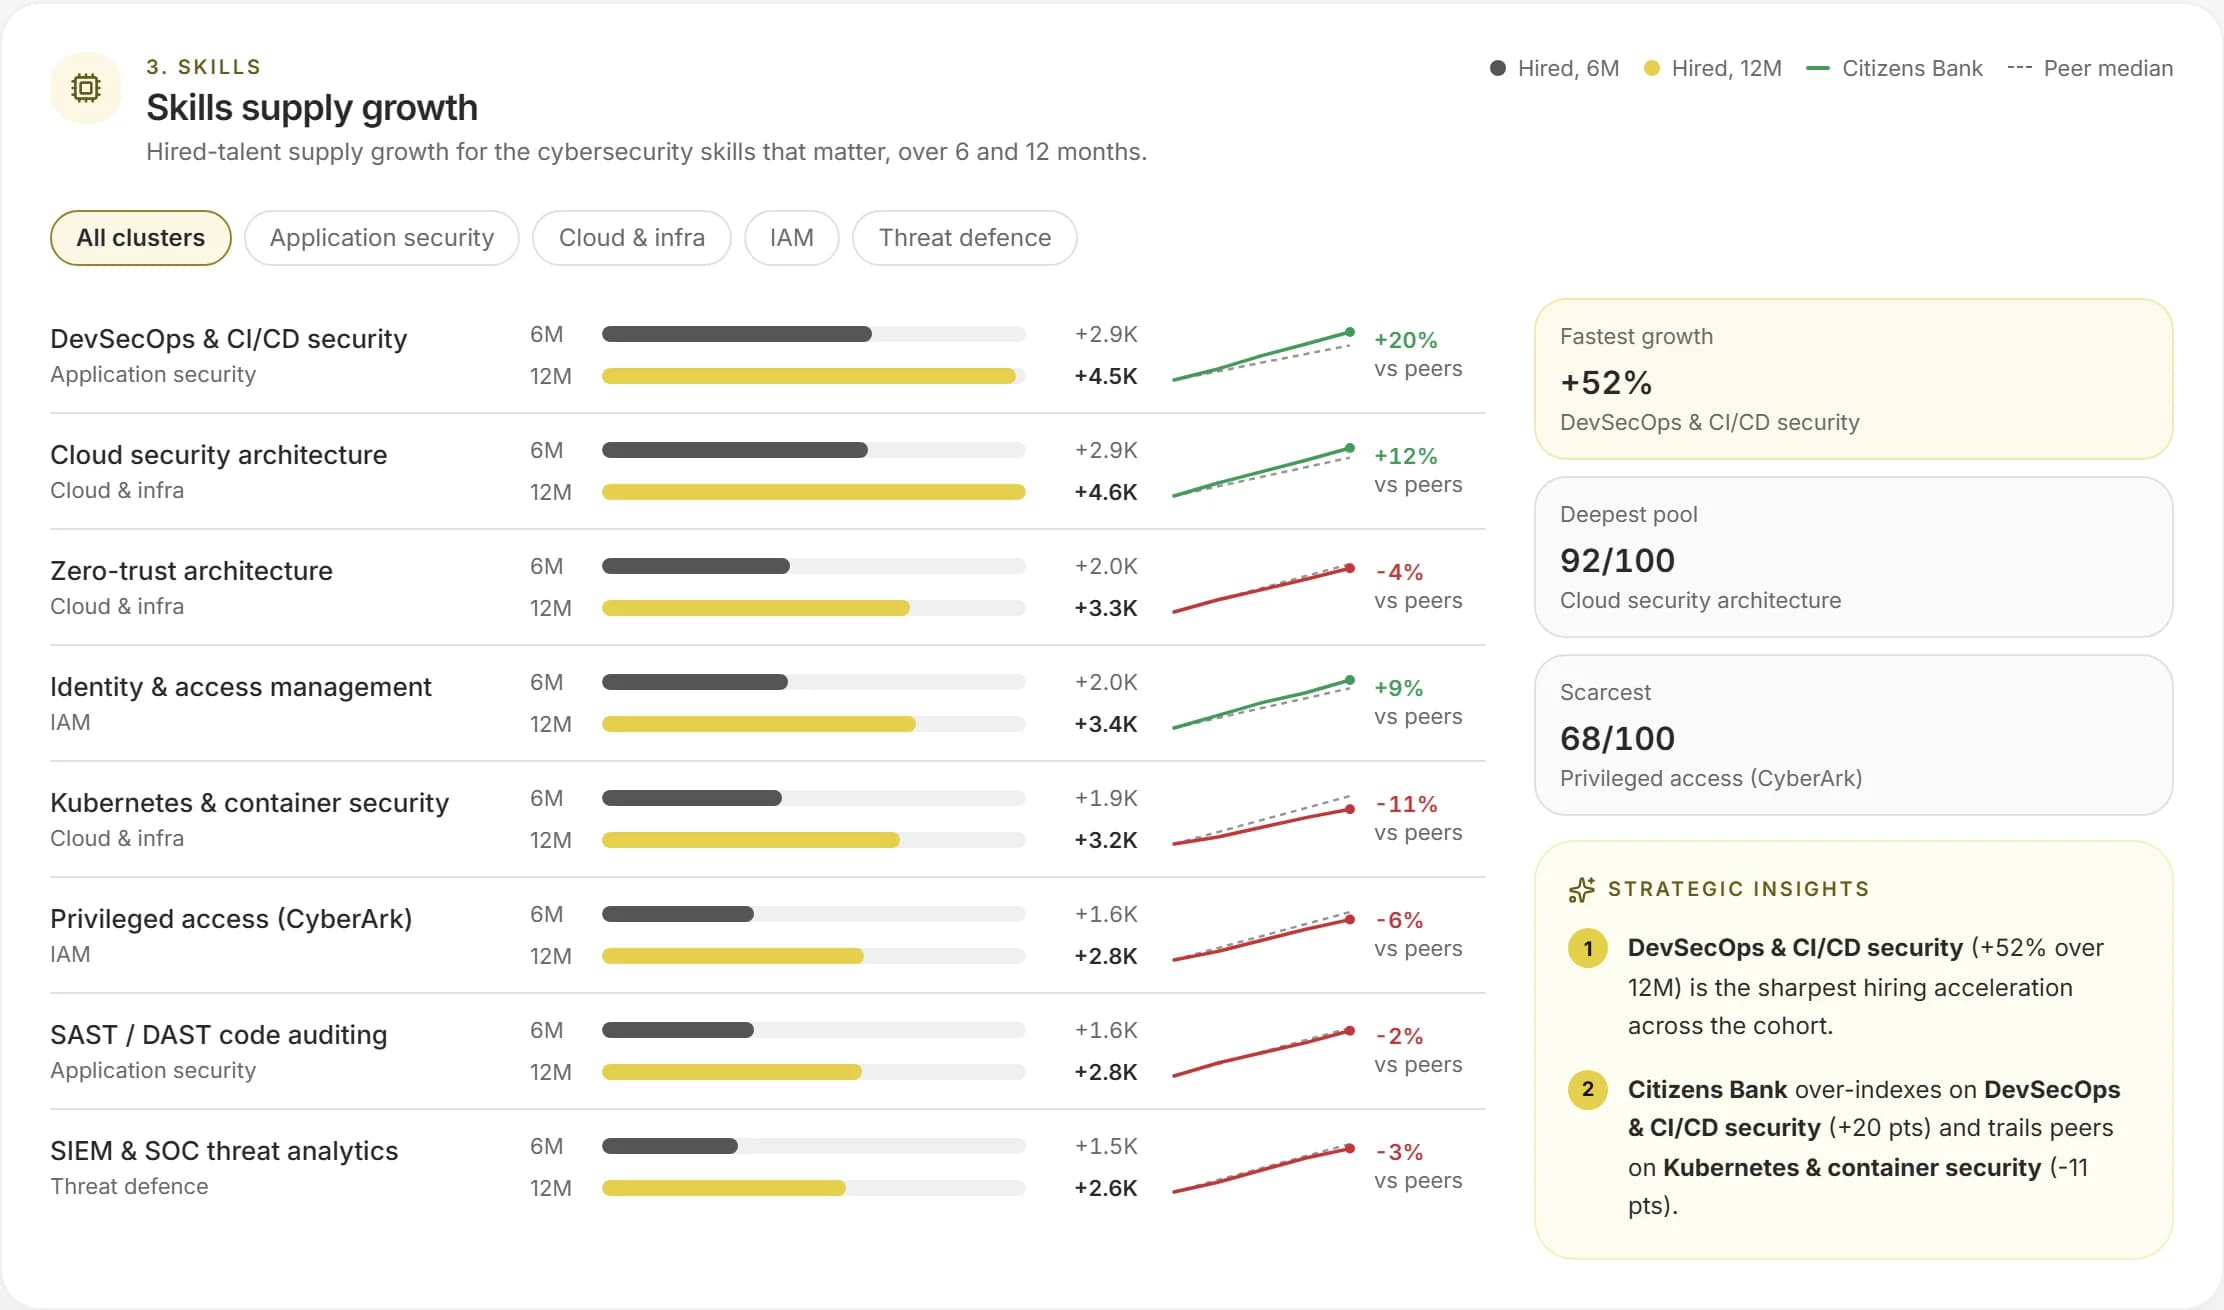 Sample data
Skill supply growth by cluster.
A screen from the product itself. The counts beside it are read from the platform directory.
- 2.85M
- people in GCCs across India
- 43
- mega GCCs, over 10,000 people
- 35
- Indian cities with a centre
- 2,500
- company profiles
Workforce & Skills, in four parts.
Each part is something the product does today, with the data it uses named on the page.
Where the workforce sits
Reported centre headcount by city and company, and the shares of the market each hub holds.
What is being hired
Job postings attributed to GCCs, by function, job family, role group, experience and seniority, with the cities and industries behind them.
How the mix moves
Month-on-month paired bars show this period against the previous one for every breakdown, over 30, 60 or 90 days, or six and twelve months.
What a skill is worth
The pay uplift for skills such as Generative AI, Machine Learning and Agentic AI, for the market, a function or a company.

The market, company by company.
Every GCC on the list has a profile, and every profile rolls up into the cities, industries, skills and pay layers you filter by. Start from the whole market and narrow to one company, or start from one company and see the market around it.
Request access- 0
- GCCs set up since 2021
- 0.0%
- Of the workforce is in Bengaluru
- 0
- Operating centres
- 0
- Platform industries
How hiring activity is cut
The same postings can be read through each of these lenses, and every chart on the Demand view respects the filters you set.
- 01
Function
The top of the taxonomy: engineering, data, operations and the rest.
- 02
Job family
A function's families, such as software, data and cloud.
- 03
Role group
The specific roles inside a family.
- 04
Seniority and experience
From pre-career to lead and manager, and by experience band.
- 05
City and industry
Where the demand sits, and which Platform Industry is asking.
- 06
Top employers
Which centres are posting the most.
Ask the question the way you would ask a colleague.
These are the kinds of questions this page is built for. Each one is answered from the data on it, not from a general model of the market.
Which functions are hiring the most across GCCs, and has that changed over the last 90 days?
Which cities lead for data and AI roles?
How is senior hiring changing compared with early-career hiring?
Which companies are posting the most roles in a city?
Which skills carry the highest premium in the market, and how sure are we?
How big is a company's reported workforce in each hub?
From first look to a decision you can show.
Pick a scope
Choose a city, industry or seniority, and drill from function to role group.
Choose the window
30, 60 or 90 days, or six or twelve months, for every chart at once.
Read the shift
See this period beside the previous one, with the numbers on the bars.
Check the skills
Open the skill premium view for the same scope.
Built for the people who own the decision.
Talent acquisition leaders
Where demand is concentrated and who competes for it.
Workforce planners
A market-based check on hiring plans.
Learning and capability leads
Which skills are being paid for.
What is in it, and what is not yet.
We say plainly what the data holds today and what we are still adding, so nothing here is implied.
- Hiring activity with about 19 months of history in the latest feed
- Reported workforce by hub and company
- Skill premiums for the market and companies, September 2026
- Month-on-month views for every breakdown
- Talent-supply pools by function and seniority
- Skills extracted from every posting
The terms on this page, defined.
Every figure on a CapSight page comes with its definition, so you never have to guess what a number is counting.
- GCC
- A Global Capability Centre: a centre a company runs in India for its own global work, such as engineering, analytics, finance, operations or support. It is part of the company, not an outside vendor.
- Platform Industry
- The one industry grouping CapSight uses for every company, so a filter or a chart means the same thing on every page. There are 10.
- Tier 1 and Tier 2 cities
- Tier 1 is the eight established hubs: Bengaluru, Chennai, Hyderabad, Mumbai, Pune, Delhi NCR, Kolkata and Ahmedabad. Every other city is Tier 2.
- Operating centre
- A company's presence in one city. A GCC with centres in three cities has three, which is why centres outnumber GCCs.
- Setup year
- The year a company set up its India GCC, where it is recorded: 1,895 of 2,500 companies have one. It is the basis of the setup eras the skyline shows.
- Median and percentiles
- The median (P50) is the middle value: half the sample sits below it. Percentiles show the spread around it, so a median is never quoted without its band.
Before you ask.
Does hiring activity equal demand for people?
It measures employer activity in postings. It does not by itself say how easy a role is to fill.
Where history is short, what do I see?
The periods that exist, with a note on when history begins. Nothing is filled in.
Can I filter by several cities?
Yes. City, industry and seniority accept several values at once.
Bring the GCC decision you are working on.
Where to put the next 300 engineers, what a peer pays its architects, who owns the charter you are selling into. Ask it in CapSight, and see the market, the peers and the people behind the answer.
Already on CapSight? Sign in
- 01Request access
We set up your organisation and its admin, who adds the team.
- 02Ask the question you have
Market, peer, pay or people, answered from one dataset.
- 03Walk it through with us
A 30-minute session with the research desk, on your decision.

Capability maturity of five BFSI GCCs in Bengaluru, by function.
Illustrative example